The Digital Decay Dendrogram

This visualization first appeared in my article "Bits and Bytes Don't Leave Bones," published in Anthropology News' Migration Issue.

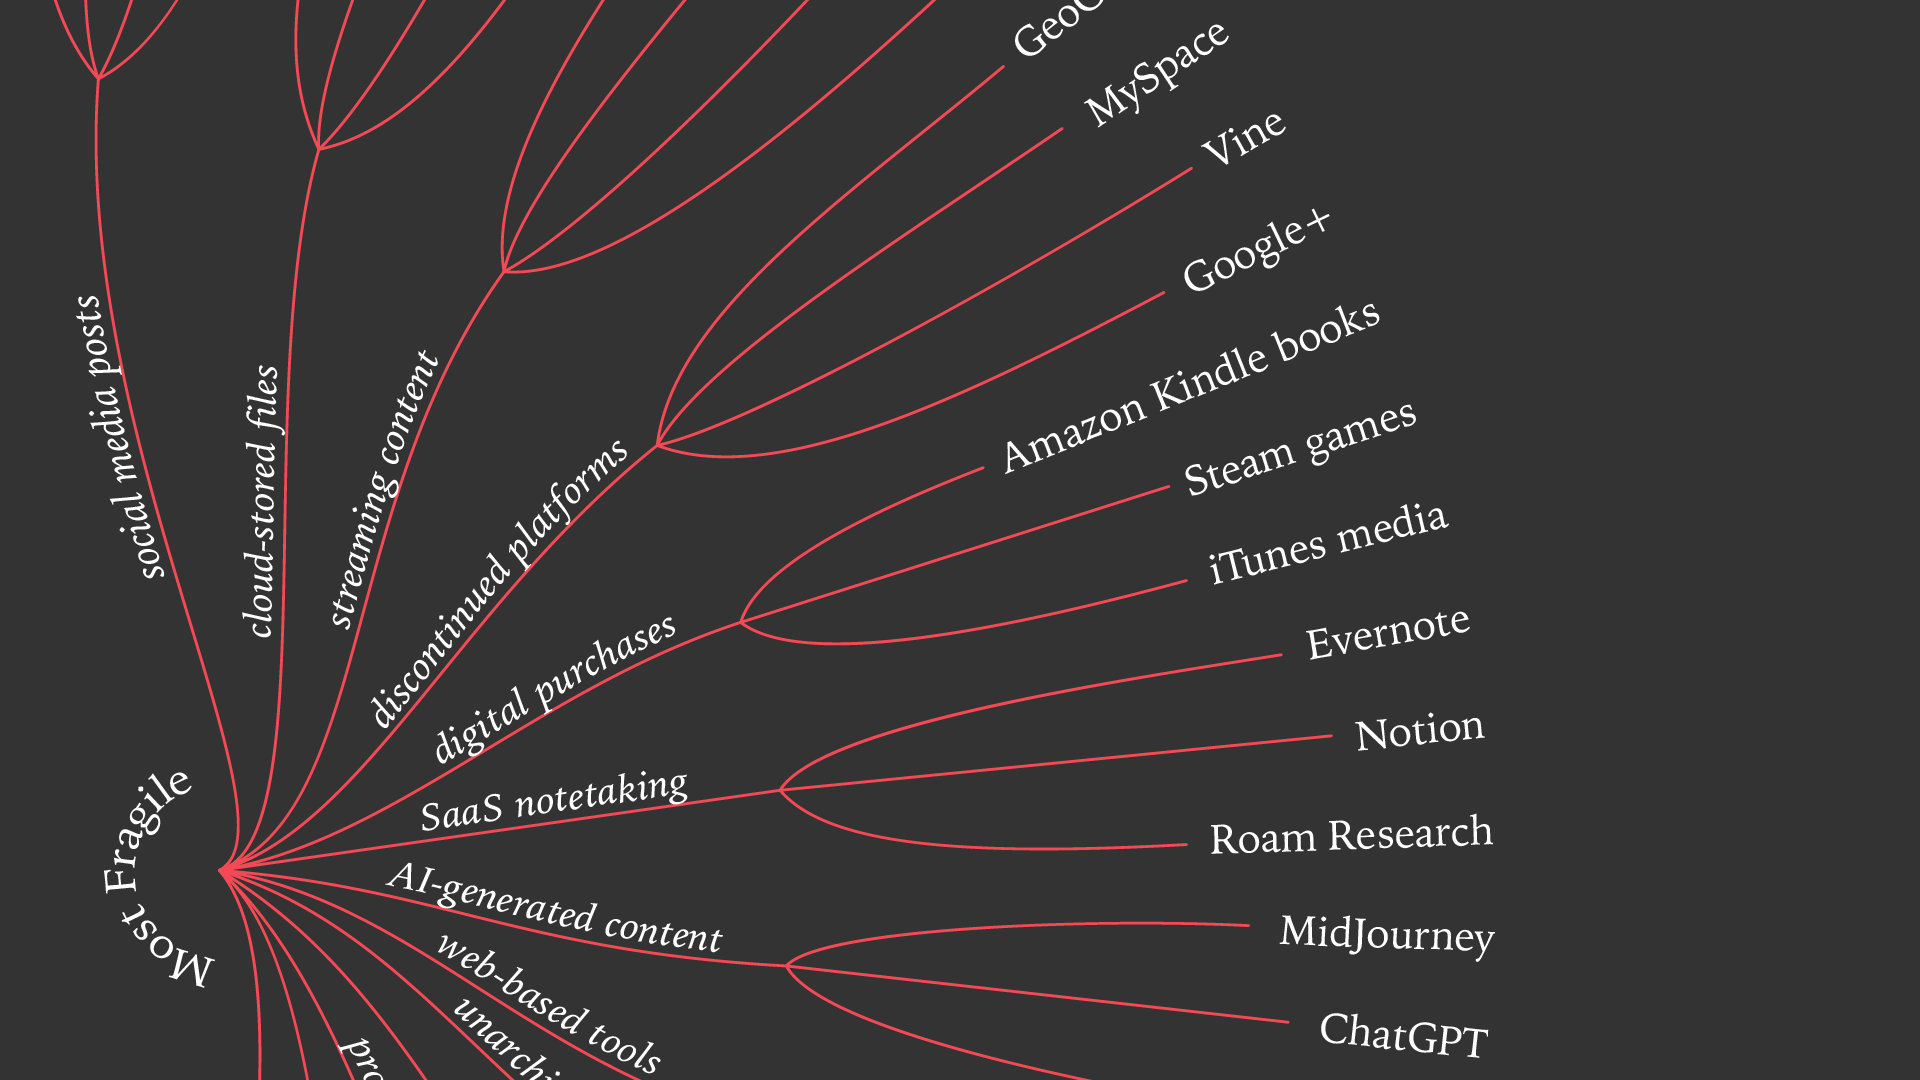
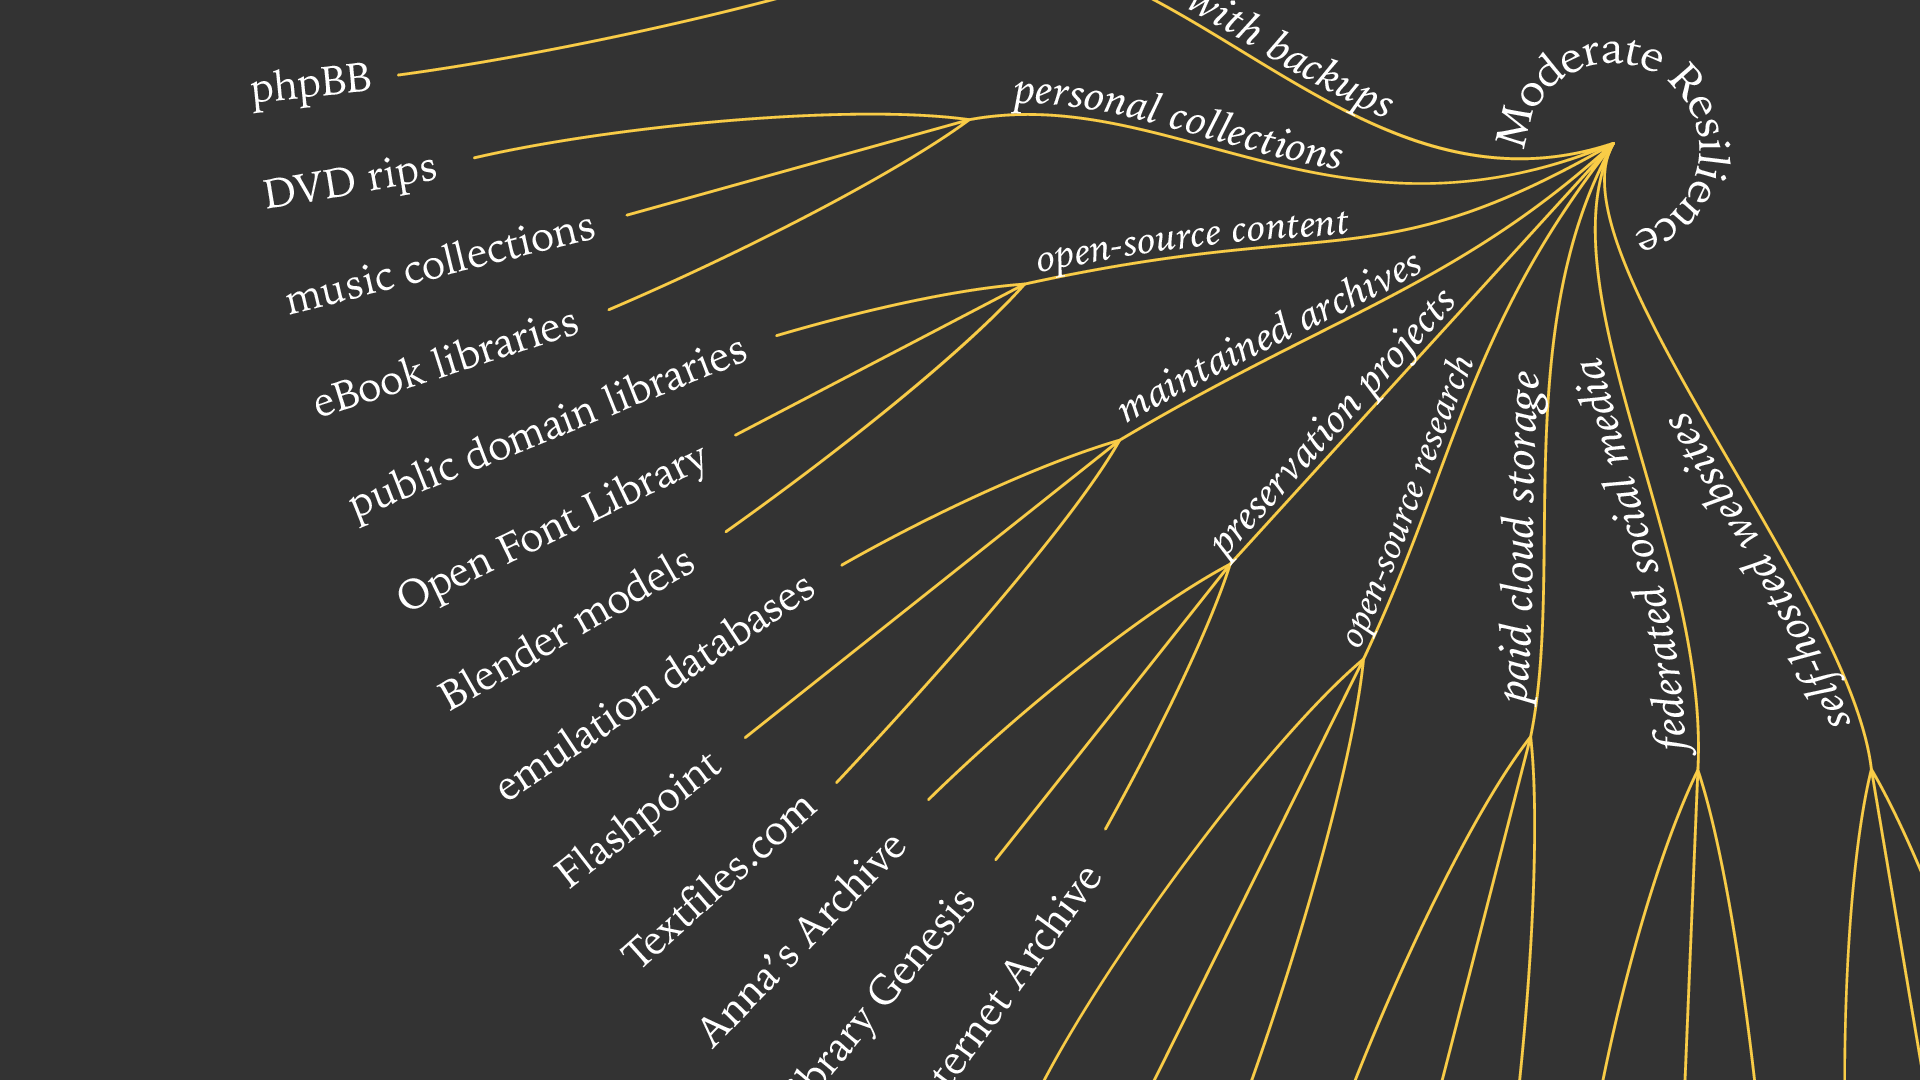
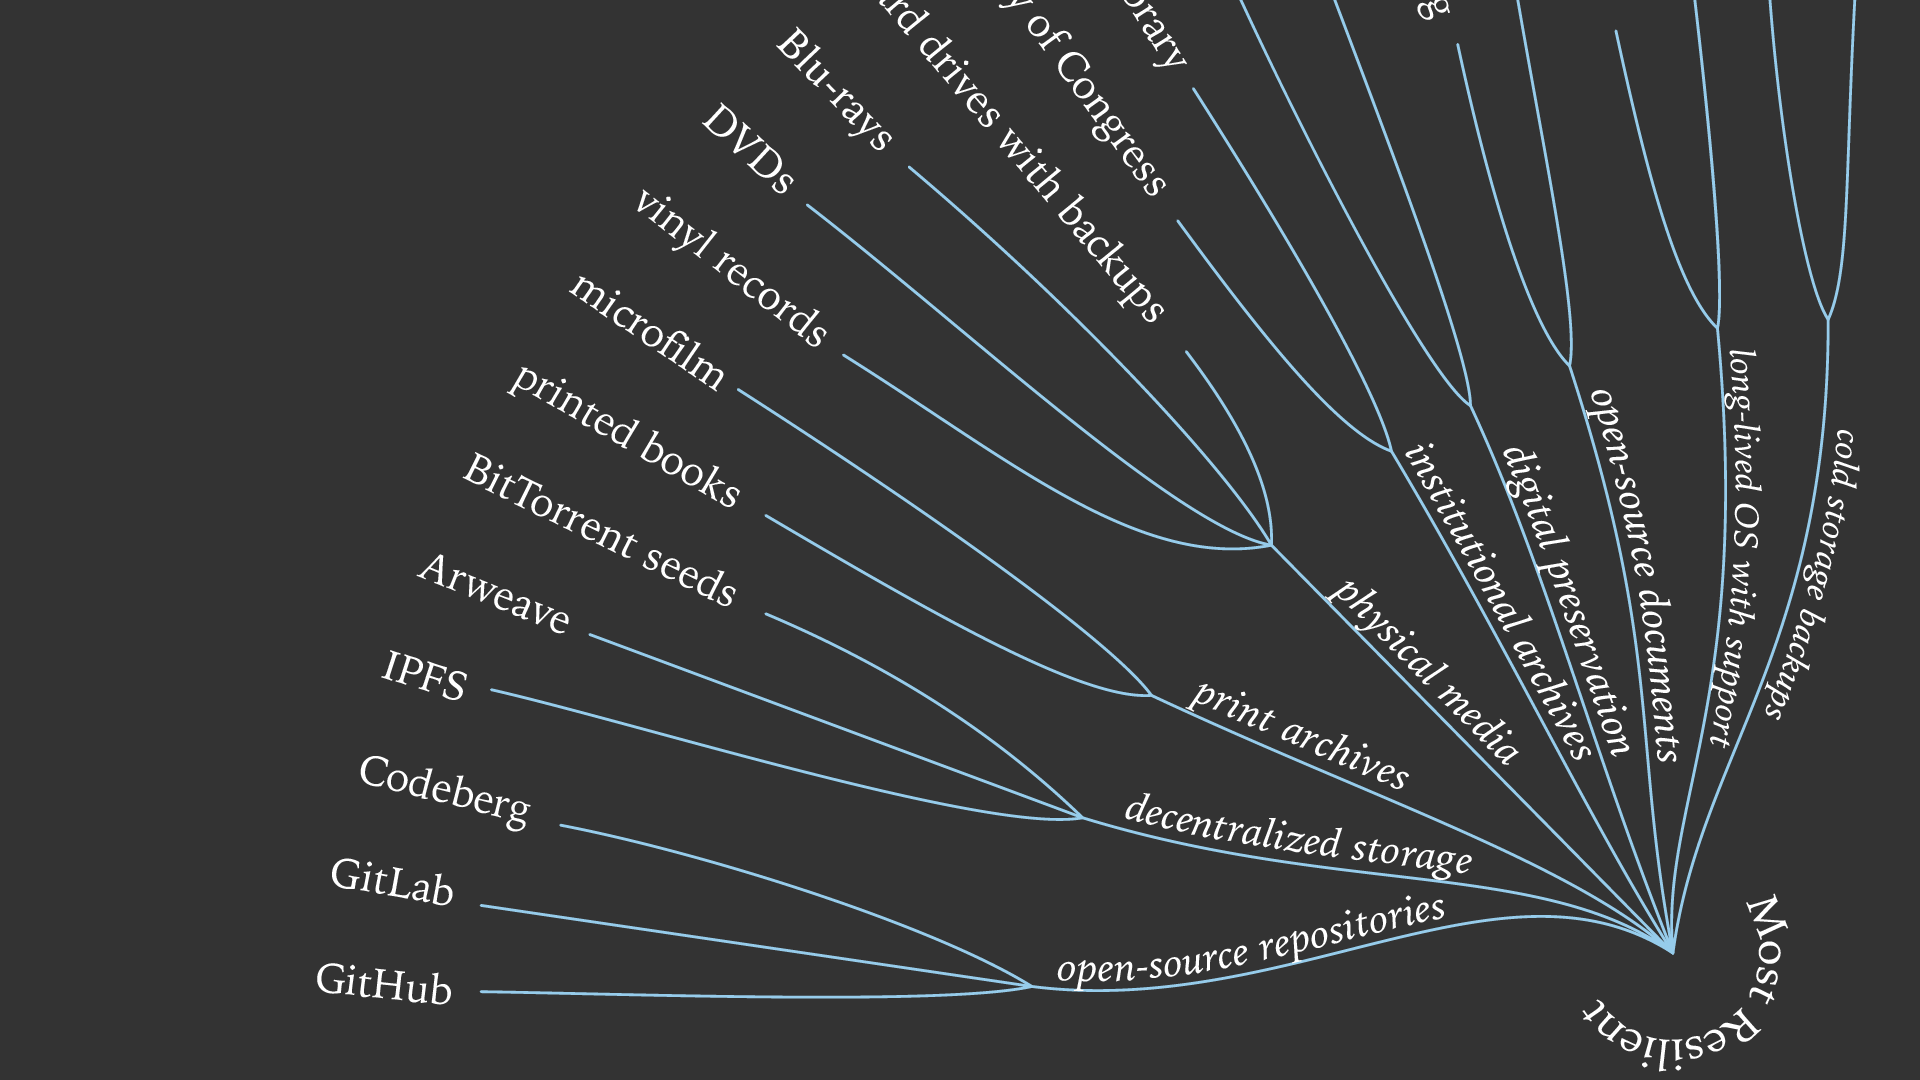
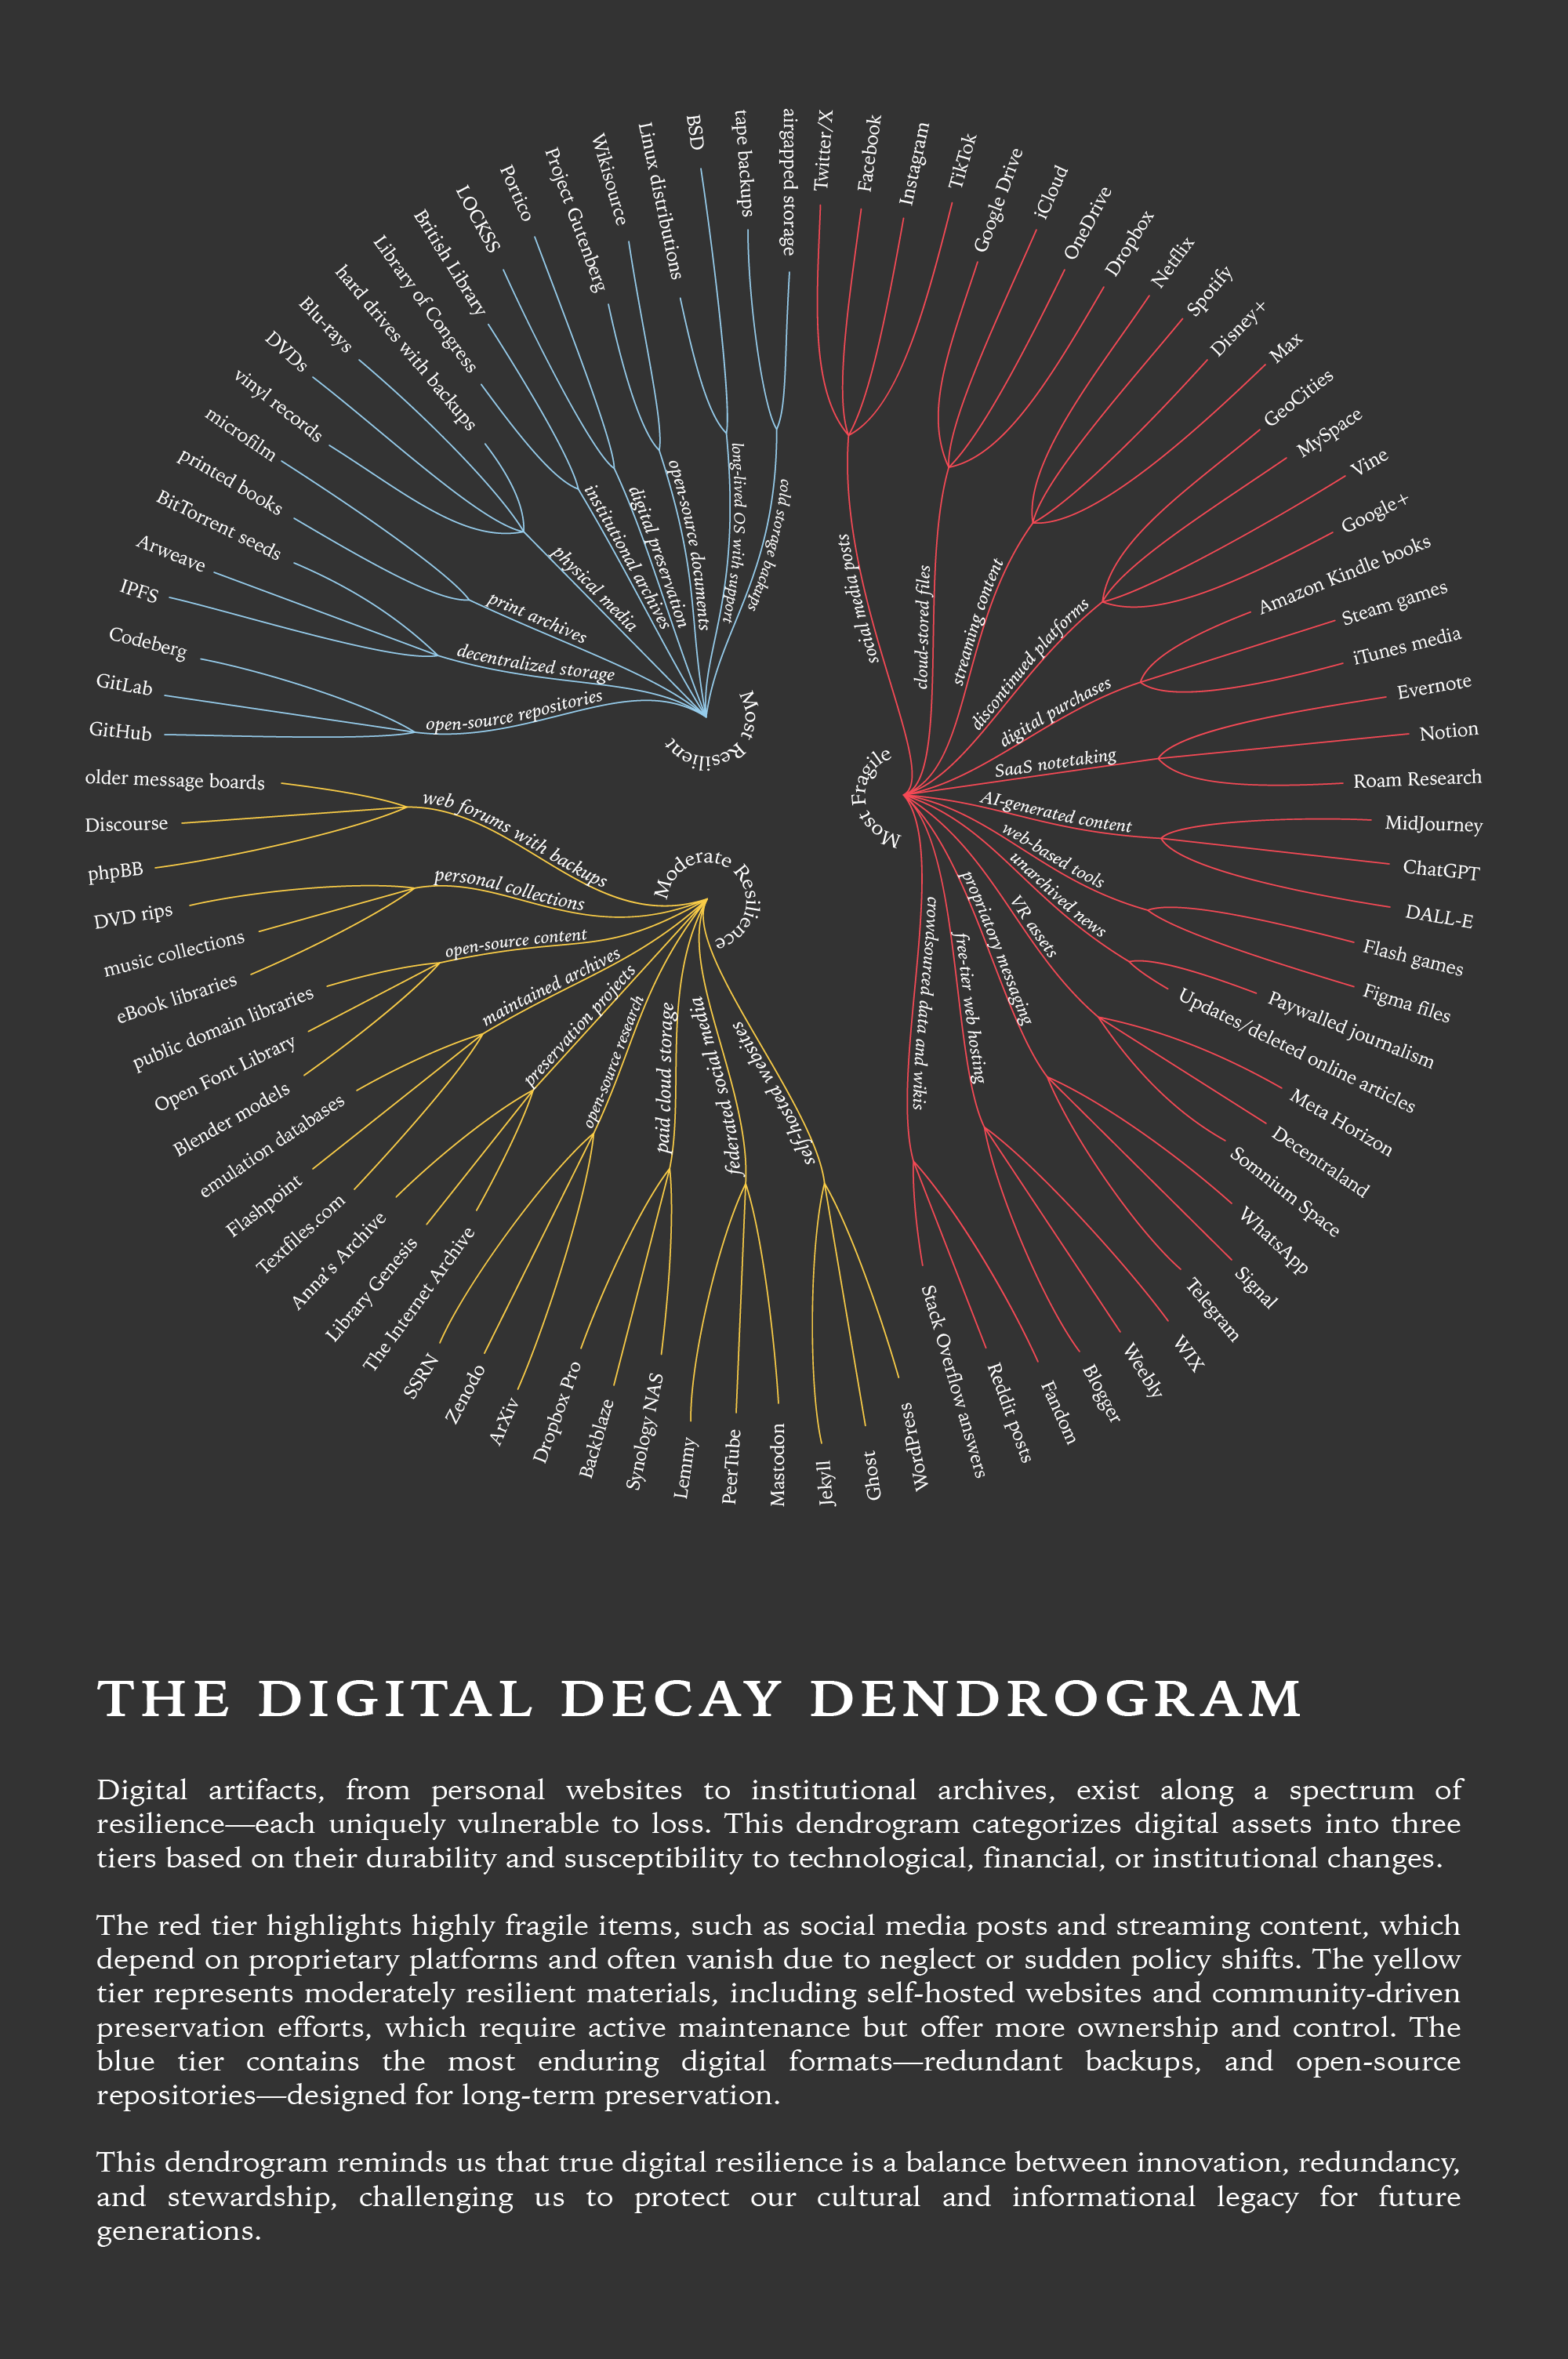
Digital artifacts, from personal websites to institutional archives, exist along a spectrum of resilience—each uniquely vulnerable to loss. This dendrogram categorizes digital assets into three tiers based on their durability and susceptibility to technological, financial, or institutional changes.

A circular dendrogram titled 'The Digital Decay Dendrogram,' categorizing digital artifacts based on their resilience to loss. The chart has three main sections: 'Most Resilient' (blue), 'Moderate Resilience' (yellow), and 'Most Fragile' (red). Each section branches out to include specific examples, such as open-source repositories, federated social media, and print archives in the resilient category, while cloud-stored files, social media posts, and streaming content fall under the fragile category. The design uses a dark background with colored branching lines to illustrate different levels of digital durability.

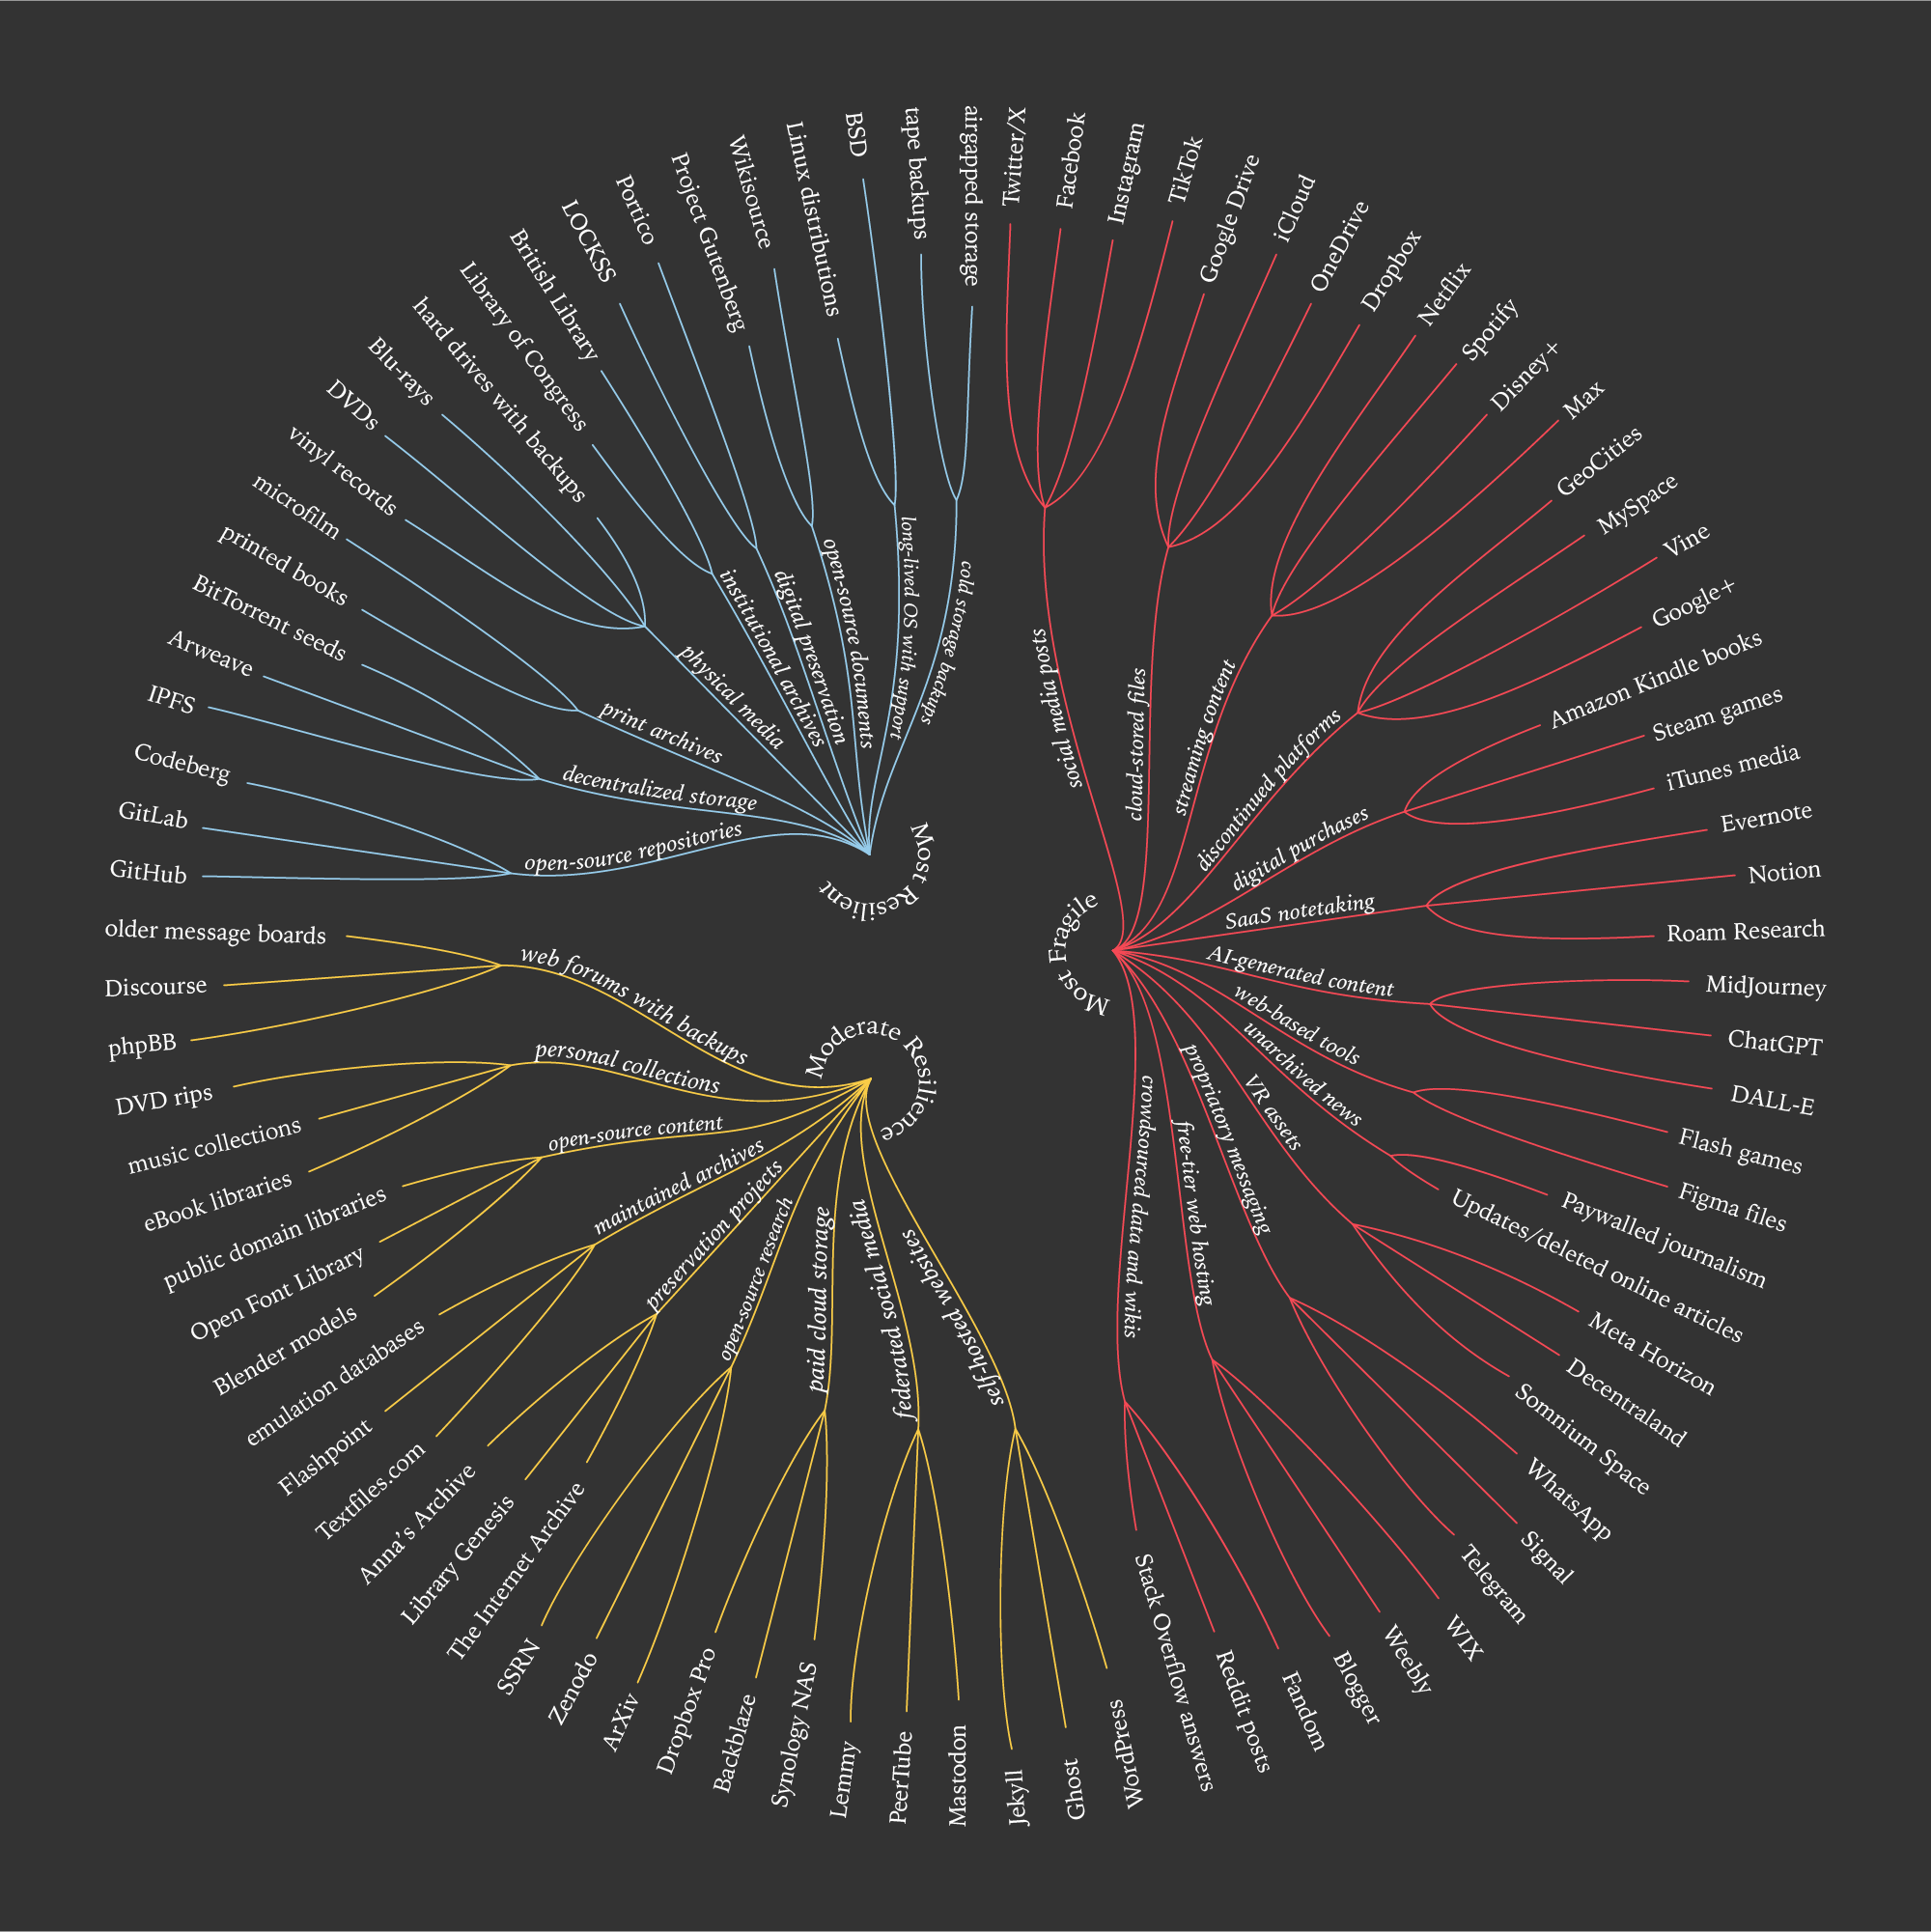
The red tier highlights highly fragile items, such as social media posts and streaming content, which depend on proprietary platforms and often vanish due to neglect or sudden policy shifts. The yellow tier represents moderately resilient materials, including self-hosted websites and community-driven preservation efforts, which require active maintenance but offer more ownership and control. The blue tier contains the most enduring digital formats—redundant backups, and open-source repositories—designed for long-term preservation.

This dendrogram reminds us that true digital resilience is a balance between innovation, redundancy, and stewardship, challenging us to protect our cultural and informational legacy for future generations.

A close-up view of the 'Most Fragile' section of the Digital Decay Dendrogram, highlighted in red. This category includes digital artifacts that are highly vulnerable to deletion, obsolescence, or policy changes. Branches list examples such as social media posts, cloud-stored files, streaming content, discontinued platforms (e.g., MySpace, Vine, Google+), digital purchases, AI-generated content, and unarchived online journalism. The visualization emphasizes the impermanence of these formats, which often depend on proprietary platforms.
A close-up view of the 'Moderate Resilience' section of the Digital Decay Dendrogram. This section, in yellow, includes digital artifacts that require active maintenance but offer some control over preservation. Examples include personal collections, open-source content, preservation projects, and federated social media. The branches highlight formats like eBook libraries, music collections, and self-hosted websites, which depend on continued user effort for longevity.
A close-up view of the 'Most Resilient' section of the Digital Decay Dendrogram, highlighted in blue. This category includes digital formats with high durability and redundancy, such as institutional archives, print books, vinyl records, open-source repositories, and decentralized storage networks like IPFS and GitHub. The visualization emphasizes the long-term stability of these formats due to their physical nature, open-source structure, or redundancy in multiple locations.
A poster version of the Digital Decay Dendrogram, including the full circular diagram and an explanatory text below. The text describes how digital artifacts vary in resilience, categorizing them into three tiers: fragile (red), moderately resilient (yellow), and highly resilient (blue). It highlights the importance of redundancy, ownership, and open formats in preserving digital culture. The dark background and structured layout emphasize the visualization’s theme of digital permanence versus loss.